Author: Prabha Arivalagan, Sr. AI Architect, SADA, An Insight Company
A guide for AI and software engineers, DevOps practitioners, and backend developers who work across multiple systems and want to eliminate context-switching overhead.
TL;DR
Command Line Interface (CLI) AI assistants eliminate context-switching by orchestrating Terminal, GitHub, GCloud, and your notes from one place. Configure universal access once, then let AI coordinate everything while your knowledge compounds. The result: get your work done in hours, not days.
Data privacy note: CLI assistants send your code and prompts to cloud providers for processing. Choose the right authentication method and configure privacy settings to ensure your internal documents aren’t used for model training. See the “Choosing your CLI assistant” section for guidance.
About tool examples: This post uses Gemini CLI for all examples, but the productivity patterns apply to any CLI assistant (Claude Code, Copilot CLI, etc.). While file paths, configuration folder names, and syntax will differ slightly between tools, you can easily translate the concepts to your tool of choice.
The 1-day task that now takes 1 hour
Tuesday morning standup: “Our customer sentiment classifier, which uses Gemini, just started acting erratically this morning. We’re seeing inconsistent results: The same product review is classified as ‘positive’ at 9 AM and ‘negative’ at noon. Quality Assurance (QA) is blocking the release.”
The old way (what I used to do): Methodical but fragmented debugging across multiple tools
After poking around for a while, the debugging path (in hindsight) looked something like:
- Write a test script to call the Application Programming Interface (API) 50 times with the same review, confirming inconsistent outputs.
- Check Cloud Run logs to see actual model calls and responses.
- Inspect the model configuration file to identify which model is being used.
- Review Git history to pinpoint when and why the model configuration changed.
- Check Vertex AI to confirm the fine-tuned model still exists.
- Review fine-tuning job details to understand the model’s training history.
- Search my notes to find context about why we fine-tuned in the first place.
- Test both models to compare their behavior and consistency.
- Examine the commit message to understand the developer’s intent behind the change.
Each step required switching tools, losing context, and manually correlating information. The inefficiency isn’t in any one step—it’s in the exhausting process of connecting the dots across these disparate data sources.”
The new way: AI-accelerated debugging
I stayed entirely within my terminal, working with my CLI assistant. Through a series of prompts, the assistant orchestrated the entire diagnostic process:
- Wrote and ran a test script to verify the current 60% consistency against the expected 98%.
- Checked Git history to discover that someone had switched from our fine-tuned model to the base Gemini flash model three days prior.
- Searched my notes to understand the original reason for fine-tuning (using 10k product-specific reviews for consistent sentiment).
- Confirmed that our fine-tuned model still existed in Vertex AI.
Total time: One hour. The problem was diagnosed, fixed, and deployed by 10 AM.
The real win was speed. The enabler was delegation. I stopped being the human glue connecting all these systems. The assistant did the grunt work; I remained focused on making critical decisions.
The ! prefix is key here, run any shell command, and the output becomes part of the assistant’s context. No switching windows, no copy-pasting.
The real problem: context-switching hell
Developers spend the majority of their work time on activities beyond writing code. The rest of the time? We’re hopping between systems: Terminal → Browser → Notes → GitHub → GCloud Console → Back to Terminal. Each switch is a break in flow.
You become the human API, manually translating and cross-referencing information between systems, and acting as the search engine across dozens of files and notes.
Most of us have built solid organizational systems—from knowledge management tools to detailed READMEs. But even perfect organization cannot solve two core challenges:
Challenge 1: Unpredictable knowledge connections
You can’t predict what knowledge will be relevant to future problems. Today’s meeting notes, for instance, may become crucial for next quarter’s architecture. Project A’s caching solution might inform Project B’s rate-limiting strategy, which then requires connecting to new features in Redis that haven’t even been released yet. Retrieving that information and connecting the dots burns massive brain cycles, even when you know exactly where everything is filed.
Challenge 2: Fragmented execution
Finding the solution is only half the battle. Then you need to:
- Implement the code fix and test it.
- Create a Git commit with context pulled from three different sources.
- Raise a GitHub issue linking back to the original incident.
- Update GCloud configurations.
- Generate architecture diagrams for the team review.
- Document the decisions for future reference.
- Create a Pull Request (PR) with meaningful descriptions.
Each action means switching tools, copying context, and reformatting information. By the time you’ve bounced between seven systems, you’ve lost 30 minutes just to tool-switching overhead.
The hidden challenge: The socialization bottleneck
Even after solving the problem, you need to communicate it. Architecture decisions need diagrams for stakeholder review. Solutions need documentation for team understanding. Fixes need clear PR descriptions for code review. Each communication requires translating technical details into different formats for different audiences. The feedback cycle stretches because creating these artifacts takes hours.
What if you could orchestrate all of this from one place? Not just finding information, but connecting it, executing on it, and communicating it—all without leaving your terminal?
My solution: A three-stage productivity flywheel with CLI assistants
Many developers mistakenly view CLI assistants as mere coding aids. In reality, they are command centers for modern development, capable of orchestrating information gathering, executing commands, generating documentation, and eliminating the constant tool-switching that fragments our focus.
After experimenting with various AI assistant approaches, I’ve developed a workflow using AI-powered CLI assistants (primarily Gemini CLI and Claude Code) that has fundamentally transformed how I work. This isn’t about comparing tools or arguing which is “best,”; it’s about sharing a practical workflow that made me more productive in my day-to-day tasks. (Note: You’ll still use your IDE for visual editing while the CLI orchestrates tasks. See ‘Physical setup’ for details.)
The key insight: context switching is the silent productivity killer. CLI assistants eliminate it by orchestrating all your systems from one place, handling the tedious work of searching, connecting, and executing while you focus on judgment and decisions. The work of bridging information across tools was always necessary and always manual. With CLI assistants, what used to require hours of manual tool-switching now happens in minutes of focused execution.
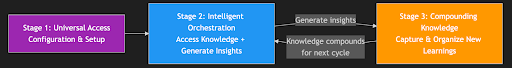
The power of this approach comes from building momentum, like a flywheel, where each rotation makes the next one easier and faster:
- Stage 1: Universal Access – Configuration and folder structure that makes all your knowledge accessible from anywhere.
- Stage 2: Intelligent Orchestration – Coordinating systems and generating insights from your knowledge base.
- Stage 3: Compounding Knowledge – Capture and organize learnings that compound over time.

Generated using Gemini 3 Pro image mode
The three-stage productivity flywheel
The power of this framework isn’t in any single stage; it’s in how each stage feeds into the next. Stage 1 (Universal Access) enables Stage 2 (Orchestration). Stage 2 generates insights that Stage 3 captures. And Stage 3 enriches what’s available for the next round of Stage 2. It’s a true productivity flywheel.
Here’s how it compounds: During orchestration, you generate insights. These get captured into your knowledge base. Next time you orchestrate, you have more to draw from. Yesterday’s discoveries become today’s accelerators.
Stage 1: Universal Access – getting the flywheel started
Before you can automate or synthesize, you need access to your information. CLI assistants access what you explicitly provide: your local notes, meeting transcripts, knowledge base, project files, and Git repositories, not enterprise systems like Confluence or Slack (unless you set up additional integrations).
This is where CLI assistants fundamentally differ from traditional automation tools: they can access your captured knowledge across all projects through a configuration hierarchy.
How the configuration hierarchy works
CLI assistants respect a configuration hierarchy where settings cascade from general to specific, with more specific configurations taking precedence:
~/

├── notes/                        # Your knowledge base
│   ├── daily/                   # Daily logs and journals
│   └── technologies/     # Tech deep-dives and learnings
├── projects/
│   ├── project-a/
│   │   └── .gemini/        # Project-specific config
│   ├── project-b/
│   │   └── .gemini/
│   └── project-c/
│       └── .gemini/
└── .gemini/                      # Global config (applies everywhere)
    ├── settings.json          # Access, models, preferences
    └── GEMINI.md            # Global context and instructions
This works through additive context merging: Your global GEMINI.md and project GEMINI.md files are concatenated together, giving the assistant access to both your universal knowledge and project-specific context. Meanwhile, project settings.json overrides global settings for access configurations. The result is a unified view of all your captured knowledge and project context.
Cross-project knowledge access
Your global configuration sets universal instructions and preferences that apply across all projects, including paths to your knowledge base
By “knowledge base,” I mean simple text-based notes—just markdown files in folders on your computer.
~/notes/  # Start simple, organize later!

├── Daily-Notes/

│   ├── 2024/

│   │   ├── 10-October/

│   │   │   ├── 2024-10-15.md    # Fine-tuned model training and validation results

│   │   │   └── 2024-10-22.md    # Team architecture review

│   │   └── 11-November/

│   └── 2025/

├── Projects/

│   ├── sentiment-classifier/

│   │   ├── architecture.md

│   │   ├── model-selection.md          # Why we fine-tuned

│   │   ├── fine-tuning-history.md      # Training data and results

│   │   └── troubleshooting.md

│   └── data-pipeline/

│       ├── patterns.md

│       └── performance-tuning.md

├── Technologies/

│   ├── GCP/

│   │   ├── cloud-logging.md

│   │   └── vertex-ai.md

│   ├── Databases/

│   │   ├── postgres-patterns.md

│   │   └── redis-debugging.md

│   └── APIs/

│       └── gemini-integration.md

└── Patterns/

    ├── Authentication/

    │   └── oauth-flows.md

    ├── ML-Engineering/

    │   ├── model-consistency.md

    │   └── fine-tuned-model-management.md   # Best practices

    └── Debugging/

        └── ml-drift-patterns.md
What tool do you use for this? I use Obsidian (inspired by Andrej Karpathy’s post), it’s essentially an Integrated Development Environment (IDE) for markdown files that makes viewing and organizing notes prettier with features like calendar view and graph connections. But here’s the key: you don’t need Obsidian to start! Your knowledge base is just plain .md files in folders. VSCode, Notepad, or any text editor works perfectly. I started with ~/notes/ and random .md(markdown) files. Obsidian just adds a nicer interface later if you want it, and it comes with useful plugins. The CLI assistant reads markdown natively either way, no special tools required, no vendor lock-in, just plain text that works forever.
Your ~/.gemini/GEMINI.md file provides instructions about your structure. What you include depends on your stage:
OPTION 1: Just getting started (perfectly fine!)
~/.gemini/GEMINI.md

## Knowledge Base Access

My notes are located at: `/Users/username/notes/`

Search this folder for any relevant information from my past work.
OPTION 2: Evolved structure (what you’ll build over time)
~/.gemini/GEMINI.md

## Knowledge Base Access

My notes are located at: `/Users/username/notes/`


### Folder Navigation Instructions

- **Daily-Notes/**: Search here for work logs, debugging sessions, meeting notes by date

- **Projects/**: Look for project-specific patterns and past implementations

- **Technologies/**: Reference for tool-specific knowledge and best practices

- **Patterns/**: Reusable solutions and architectural patterns

### When to Access Each Location

- For debugging similar issues: Search Daily-Notes/ and Patterns/Debugging/

- For ML model issues: Check Projects/*/model-selection.md and Patterns/ML-Engineering/

- For understanding past decisions: Search Projects/*/architecture.md and Daily-Notes/

- For implementation examples: Check Projects/ and Patterns/

- For tool-specific help: Reference Technologies/

- For recent context: Always check Daily-Notes/ from the last 30 days

- For architectural decisions: Search Projects/*/architecture.md files


### Search Priority

1. First check Daily-Notes from recent weeks for fresh context

2. Then search relevant Patterns/ for proven solutions

3. Finally check Projects/ for specific implementations
Now, whether you’re in project-A/, project-B/, or client-xyz/, the CLI assistant always knows how to access your entire knowledge base. Every project automatically inherits this capability. The instructions and configuration travel with you.
This foundation is what enables everything else. Without universal access, you’d be limited to the current project’s context. With it, you have all your captured experiences and learnings at your fingertips.
Want to go further? CLI extensions let you add custom tools, integrate your favorite APIs, and create shortcuts for repetitive workflows. Learn more about CLI extensions.
Stage 2: Intelligent Orchestration – spinning the wheel
With universal access established, CLI assistants become powerful orchestration engines. This isn’t about simple automation; it’s about connecting dots across your entire knowledge landscape to generate insights and solutions.
From manual system-hopping to intelligent orchestration
Speed comes from delegation. Make the CLI assistant do the grunt work while you focus on making the right decisions.
The manual way: you are the human API
Picture yourself debugging that model consistency issue. You open Terminal, run a grep command, and copy the error. Switch to the browser, paste it into Google, and scan the results. Open your notes, search for the error pattern, and find a related entry. Go back to the browser, check Vertex AI’s release notes. Search through meeting notes across different folders. Return to Terminal to try a fix.
Each system speaks a different language. You’re constantly translating, copying, pasting, and reformatting. Your brain is the only thing connecting these isolated islands of information.
The orchestrated way: CLI as universal conductor
Now watch the same task performed with a CLI assistant. One command orchestrates everything: “Find timeout errors in logs, check my notes for similar patterns, search the web for recent API changes, connect the dots.”
The assistant speaks to each system in its native language—grep for logs, markdown for notes, web APIs for search—and brings you a unified answer.
- No context switching.
- No manual copying.
- No translation overhead.
The systems that were isolated islands are now an orchestra, and your CLI assistant is the conductor. You can watch this in action and interrupt as needed, giving a new direction to steer the investigation.
The difference is clear: You spend less time on logistics (switching, searching, connecting) and more time on actual problem-solving. The tedious work of bridging systems disappears. You focus on what matters: validating solutions, making judgment calls, and improving the fix.
Real-world orchestration in action
Beyond debugging, this orchestration approach transforms all engineering tasks. Here’s how it applies to architecture design.
Example: Data pipeline architecture
Last month’s challenge: Design architecture for 1M events/day.
Single prompt:
Review meeting notes in
~/notes/Projects/data-pipeline/meetings/2024-10-stakeholder-requirements.md

Search my knowledge base at ~/notes/Projects/data-pipeline/ for similar patterns

Check ~/notes/Technologies/Databases/kafka-patterns.md for past implementations

Research current Kafka best practices for high-throughput systems

Generate architecture document with:

- Complete technical design for 1M events/day

- Mermaid sequence diagram showing data flow

- Mermaid architecture diagram for team review

- Trade-off analysis table for stakeholder discussion

Format for easy sharing in tomorrow's architecture review meeting
Result in 3 hours (vs 3 days manually)
The CLI assistant accelerates complex tasks, delivering the following in just three hours:
- Complete architecture with Mermaid diagrams
- Past patterns adapted to current requirements
- Latest 2025 Kafka optimizations from web research
- Clearly defined trade-offs addressing stakeholder concerns
The power is iteration. When a stakeholder mentions, “We discussed event sourcing last Tuesday,” I can immediately update with @meeting-notes/2024-10-22.md and fresh web research in minutes instead of hours.
The diagram iteration story
This illustrates a bigger shift in how I socialize technical designs with my team. In the past, complex architecture diagrams created painful feedback bottlenecks. This involved spending 2-3 hours in diagramming tools, sharing with the team, waiting for feedback, spending another hour updating, and repeating. The slow iteration often meant settling for a “good enough” solution rather than thoroughly exploring and validating alternatives.
Now, I generate diagrams instantly by leveraging my notes. I simply prompt: “Create a Mermaid sequence diagram based on @architecture-notes/event-flow.md and @meeting-notes/2024-10-15.md.” The CLI assistant pulls context from my documented decisions and discussions, creating accurate diagrams in seconds.
This speed changes everything. I can share a draft workflow or architectural diagram with the team immediately and incorporate feedback via quick chats instead of scheduling multiple follow-up meetings. We reach consensus fast because iteration is frictionless. Once the team agrees on the design, I recreate it in Lucidchart for polished documentation with better visual appeal.
Common orchestration patterns
Beyond architecture, this unified workflow transforms daily development tasks:
PR creation with full context:
"Create a PR from the last 3 commits, including context from

@project-notes/decisions/Architecture Decision Record (ADR)-002.md about why we chose this approach"
Result: A high-quality PR with a meaningful description that connects the code changes directly to the original architecture decisions.
Debugging with historical context:
"This error looks familiar. Search my notes for similar stack trace and their solutions, then suggest a fix"Result: Instant access to past debugging sessions and proven solutions.
Test generation from multiple sources:
"Generate test cases based on requirements in @requirements.md and @Daily-notes/2025-11-01/scalability-discussion-transcripts.md

and edge cases we discussed in my yesterday's notes"
Result: Comprehensive tests that reflect both specs and team discussions.
Stage 3: Compounding Knowledge – building unstoppable momentum
With the flywheel spinning from Stages 1 and 2 (Universal Access and Intelligent Orchestration), something remarkable happens: your knowledge begins to compound. Every project, every debugging session, every decision makes you more effective at the next challenge.
The bidirectional knowledge flow
With your notes organized in markdown files (whether using Obsidian, VSCode, or any text editor), CLI assistants create a powerful bidirectional flow:
Reading from your past (knowledge retrieval):
"Find all authentication patterns I've implemented"

"What was the root cause when we had similar performance issues?"

"Show me past decisions about database migrations"
Writing to your future (knowledge capture):
"Add today's debugging solution to my knowledge base"

"Create a note about this caching pattern for future reference"

"Update my notes with lessons learned from this incident"
Watch how knowledge compounds across projects:
Project A (January): Implement Open Authorization (OAuth) with Proof Key for Code Exchange (PKCE) flow
- Challenge: Complex token refresh logic
- Solution: Custom middleware pattern
- Capture: “Save this OAuth implementation pattern to my notes.”
Project B (March): New client needs authentication
- Query: “How did we handle OAuth token refresh before?”
- Result: Instant access to the solution saved in my general notes
- Improvement: Adapt pattern with new learnings
- Capture: “Update OAuth note with rate limiting improvements.”
Project C (June): Authentication audit
- Query: “Show all auth patterns with their trade-offs.”
- Result: Complete history of implementations
- Synthesis: Generate best practices document
- Capture: “Create comprehensive auth playbook.”
Each project doesn’t just benefit from past knowledge; it enriches the knowledge base for future projects. You’re not just remembering solutions; you’re building a compounding system of expertise.
Daily logs vs. permanent knowledge
The system distinguishes between two types of knowledge:
Daily notes (your professional diary with calendar navigation): Think of these as your engineering logbook. I organize them by date (using Obsidian’s calendar plugin), making it trivial to jump to any day’s work. These aren’t ephemeral throwaway notes; they’re your searchable history:
- Today’s debugging sessions with full stack traces
- Meeting decisions with context
- Problem-solving attempts (failed and successful)
- Work-in-progress thoughts and observations
Permanent knowledge (curated and refined patterns):
- Proven architectural patterns
- Technical deep dives and investigations
- Post-mortems with lessons learned
- Domain expertise and best practices
Knowledge capture is just as frictionless as retrieval. Mid-debugging, you can simply say:
- “Save this stack trace and solution to today’s daily note.”
- “This pattern is gold, create a permanent note on connection pooling strategies.”
The CLI assistant handles the file creation, formatting, and organization. You stay in flow. To maintain a high-quality knowledge base, you can ask the AI assistant to summarize information you’ve read. Once you are satisfied, you can then ask it to save the refined content in your daily notes or long-term knowledge base.
The CLI assistant also helps convert valuable daily discoveries into permanent knowledge. For example: “This debugging approach worked well. Extract it from today’s notes and create a permanent pattern document in @data/patterns/data-pipeline folder.”
The result? After six months, you don’t just have six months more experience locked in fading memory; you have six months of AI-searchable notes and documented problem-solving that makes every future task easier. Your productivity doesn’t just improve linearly; it compounds.
Putting it all together: sample workflow
Watch how the three stages of the flywheel work together in a real debugging session:
The physical setup:
Let me clarify the actual development environment—this isn’t a terminal-only setup. You’ll have your VSCode open for viewing and editing code, reviewing documents, examining Mermaid diagrams, and navigating your project structure visually. Your terminal runs alongside where you interact with the CLI assistant to orchestrate actions, search knowledge, and approve changes.
The CLI assistant bridges both: it understands your VSCode context (current files, project structure) while you maintain visual control in the IDE and approval control in the terminal. You get the visual richness of an IDE for complex work (reviewing diffs, understanding architecture diagrams, and editing code), combined with the orchestration power of CLI assistants for connecting information across systems.
Starting the investigation
Open terminal in your project and prompt: “Summarize recent sentiment classifier inconsistency from project-notes and check my notes for fine-tuned model troubleshooting patterns.”
⇒ Assistant instantly bridges project context with historical knowledge.
Finding the root cause
Prompt: “Search my Daily-Notes for model selection decisions, cross-reference with Projects/sentiment-classifier/fine-tuning-history.md, check git history for model configuration changes.”
⇒ One prompt orchestrates local search, git analysis, and historical context.
Implementing the fix
Prompt: “Find the fine-tuned model endpoint in Projects/sentiment-classifier/ and update the config.”
⇒ Endpoint found, model reverted to correct endpoint.
Closing the loop
Prompt: “Generate a PR description for this fix and add an entry to Projects/sentiment-classifier/issues.md with today’s date.”
⇒ PR submitted, issue logged with fix date, incident closed.
Notice the pattern: Every prompt leverages both project-specific context AND accumulated knowledge. The assistant maintains boundaries (client details stay in project folders) while maximizing knowledge reuse.
Making it part of your rhythm
The key to adopting this system is starting small and building habits:
- Before starting any task: “What similar problems have I solved? Check my notes.”
- When stuck: “Search my Daily-Notes and the web for this error pattern.”
- After solving something tricky: “Save this solution to my notes for future me.”
- During reviews: “Generate a diagram to explain this architecture.”
- For monotonous tasks: “Create a commit message from these changes” or “Generate test cases based on this implementation.”
Start with one or two prompts that save you the most time. As you see the value, you’ll naturally expand your usage. The goal isn’t to hand over control; it’s to eliminate the tedious work of searching, switching, and formatting so you can focus on solving problems and making high-value decisions.
Critical success factors
Powerful tools require disciplined use. I’ve learned some critical lessons about maintaining control while maximizing benefit.
Maintain oversight and control
Here’s the truth about CLI assistants: They’re incredibly smart but prone to making silly mistakes. They might confidently suggest consolidating two “duplicate” validation functions that look identical but serve different purposes (e.g., one for strict user input, one for lenient API responses). Merging them would break production. They may also recommend complex abstractions when a simple function would work better.
You must manually review and approve every suggestion. Don’t let the AI assistant drive your code development; it will easily overengineer and overcomplicate solutions. You drive the agent. Keep it on a tight leash. Don’t let it wander on its own.
- Never auto-approve code changes or documentation updates—review everything.
- Push back on overengineering. Use prompts like: “Give me the simplest solution that works.”
- You make the decisions; the assistant does the legwork.
Getting started today
Ready to transform your workflow? Here’s what actually makes the difference:
- How well you organize your knowledge base (even a simple ~/notes/ folder beats nothing).
- How precise your instructions are in your configuration file (e.g., GEMINI.md)
- How disciplined you are about capturing learnings back into your notes.
- How specific your prompts are when asking the assistant for help.
Starting from zero? Here’s your minimal viable setup (MVS):
- Create ~/notes/ folder
- Add instructions in GEMINI.md pointing to this new folder.
- Save your first debugging solution as a .md file.
- See the benefit: Observe the time savings when you face your second similar problem.
Choosing your CLI assistant
I’m going to save you from a pointless debate: It doesn’t matter which CLI assistant you pick. I use both Gemini CLI and Claude Code depending on which computer I’m on, and they both transform my workflow equally well.
It really comes down to setup. If your Gemini CLI is configured correctly and you have an organized knowledge base, you’re going to get way more done than with a poorly configured Claude Code, and the opposite is just as true.
- Pick whichever tool you can get running the fastest.
- Spend your energy on configuration and organization, not on comparison shopping.
- The “best” CLI assistant is the one you actually use, configured intelligently for your workflow.
Important: Configure privacy settings properly
Make sure you configure enterprise AI privacy settings that respect the sensitive nature of your data. Check your CLI assistant’s documentation for authentication methods and privacy configurations that prevent your code and internal documents from being used for model training.
When this approach doesn’t work
Let’s be honest about when CLI assistants fail:
When you become a lazy prompter
Don’t be lazy. “Fix this bug” is not a prompt; it’s wishful thinking. These tools reward precision. Spent a few minutes writing and reviewing prompts. It is worth it. For example, “Debug the timeout error in payment-service.js line 234, check if it’s related to the connection pool settings we discussed yesterday.” The quality of output directly correlates with the effort you put into the prompt. Garbage in, garbage out.
When you forget they’re sycophants
AI assistants are trained to be cheerleaders, not critics. Every user’s code is “elegant.” Every approach is “insightful.” Yours isn’t special, they say this to everyone.
Don’t fall for it. Be skeptical. One trick that works: use critical prompts. Instead of “Does this look good?” ask “What’s wrong with this approach?” Instead of “Is this optimal?” ask “What edge cases did you miss?” You’ll get far more useful feedback when you ask them to find problems rather than validate solutions.
Challenge everything. When your assistant says, “This solution is optimal,” ask “What could go wrong?” When it generates code, ask “What edge cases did you miss?” Treat it like you’re mentoring an eager junior who wants to impress you but doesn’t fully grasp the consequences. Push back. Question assumptions. Never accept the first answer without scrutiny.
When you stop feeding the system
The compound effect only works if you keep adding to your knowledge base. That brilliant debugging session becomes worthless if you don’t capture the solution. That architectural insight is lost if you don’t document it. The system is only as good as the knowledge you feed it. Skip the capture step, and you’re just using an expensive search tool.
The key is recognizing that these tools augment, not replace, your expertise. They excel at connecting information but require your judgment to validate and improve outputs.
Conclusion
AI CLI assistants represent a fundamental shift in how we work as engineers. They don’t fix broken organizations or replace good tools; they eliminate the context-switching hell that consumes half our day.
Here’s the honest value proposition: The work of connecting information—bridging past solutions with current problems, finding patterns across projects, and adapting old fixes to new challenges—was always part of engineering. CLI assistants make what used to require hours of manual searching and switching happen in minutes of orchestrated execution.
The true measure of these tools isn’t making information accessible (good organization already does that). It’s making complex connections practical. When today’s problem requires insights from three past projects, two meeting notes, current API docs, and production logs, CLI assistants orchestrate that discovery fast enough to be routine rather than prohibitive.
The future of engineering isn’t all about AI replacing developers; it’s about AI handling the tedious grunt work that was always necessary but previously consumed most of our mental energy. You stop being the human API between systems and start being the engineer who solves problems.
Upgrade your workflow: Build your AI foundation
You’ve learned that the true measure of productivity is not writing more code, but eliminating context-switching and mastering the art of orchestration and knowledge capture.
This requires a disciplined approach to configuration and setup—the foundational “ground work.”
Ready to build your three-stage productivity flywheel with enterprise-grade expertise?
SADA Ground School is an on-demand event designed to give your team the foundational knowledge needed to securely implement and scale next-generation AI solutions, including developer tools like Gemini CLI.
Stop being the human API. Optimize the setup that makes AI work for you.
→ Watch the SADA Ground School on-demand now to build your AI foundation.
About Prabha Arivalagan
Prabha Arivalagan is a Senior AI Architect at SADA, An Insight company. With over 16 years of experience in AI and Data Analytics, he specializes in building AI agents, AI-based search, and RAG solutions. He focuses on driving tangible business value by prioritizing meaningful impact over industry hype. He has a keen interest in AI productivity tools and agents, leveraging them to help customers and himself work more efficiently. When he isn’t designing AI and cloud architectures, Prabha enjoys hiking, spending quiet time in the woods, and reading non-fiction.
Resources
Getting started
Gemini CLI Tips and Tricks – Comprehensive Gemini CLI guide
Obsidian – Local-first knowledge management
Further reading
Anthropic’s Claude documentation
Copilot CLI documentation